Tool on calculating the working life expectancy and working years lost
Working life expectancy (WLE) can be defied as the time that a person at a given age is expected to work during his or her remaining life or during a specified age range. WLE is a population summary measure, which is forecasting a duration of working life of all individuals in a particular study population based on cumulative labour market attachment. The counterpart of working life expectancy is working years lost (WYL) - the time expected to be spent in other labour market statuses than work, which can be distributed to different reasons such as work disability, unemployment or retirement. Healthy working life expectancy (HWLE) incorporates longevity, health status and labour force participation and is defined as the time that a person at a given age is expected to be healthy and participate in working life until permanent withdrawal from the labour market.
The aim of tool is to introduce approaches for examining WLE, HWLE and WYL in research and help to apply the calculation method on their own data.
The tool is primarily targeted at researchers. However, the information generated by tool can be used by decision/policy makers. The tool can be used to monitor changes over time (within and between the countries, within specific groups) and examine factor influencing on WLE/HWLE/WYL (e.g., education, occupation, exposures, chronic diseases). Furthermore WLE/HWLE/WYL measures can be used as outcome measure in population level interventions and economical evaluations.
The tool includes two excel-based computational templates (Figure 1) and practical guide for calculating period WLE, HWLE and WYL using the Sullivan life-table method. The practical guide addresses the issues relevant for the calculation of WLE, HWLE and WYL by providing examples of published studies applying the method. The intention of the guide is to help its users apply the method on their own data, point out measurement issues that may influence the results, and introduce approaches for examining WLE in research.
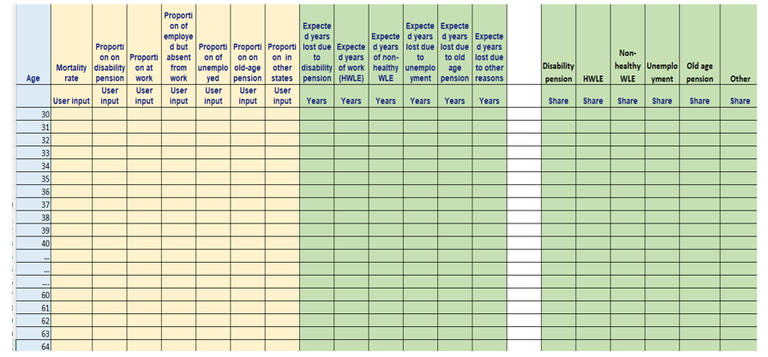
Figure 1. Excel-based computational templates
There are two computational templates. One is for calculation of WLE and WYL. Another – for calculation of HWLE and WYL. Blue area indicates the age range (Figure 2), pink area indicates columns where user’s impute data need to be inserted (Figure 3), the results of calculations will appear in the green area (Figure 5). Before use of the tool, it is required to decide which measure will be calculated - WLE or HWLE, define number of states of interest (depending on research question and available input data) and select age range for calculations. The input data can be obtained from official statistics, registers or representative population surveys.
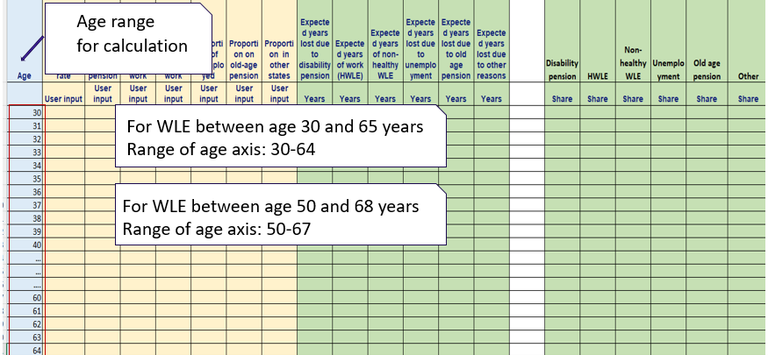
Figure 2. Defining age range for calculation. For example, for calculation of WLE between age 30 and 65, the range of age axis should be 30-64.
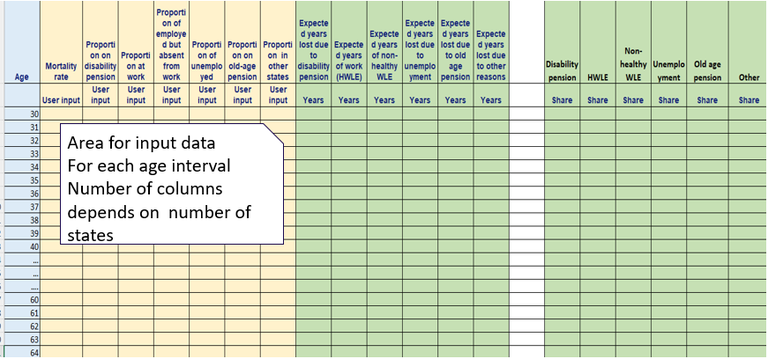
Figure 3. Area for input data.
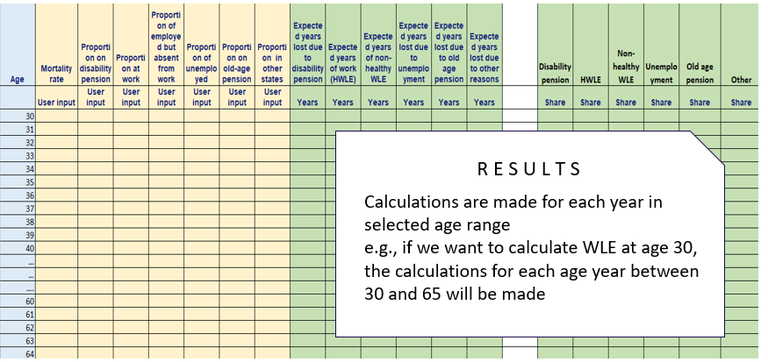
Figure 4. Results of calculations.
Figures 5 and 6 show examples of data needed for calculation of WLE and HWLE, respectively.
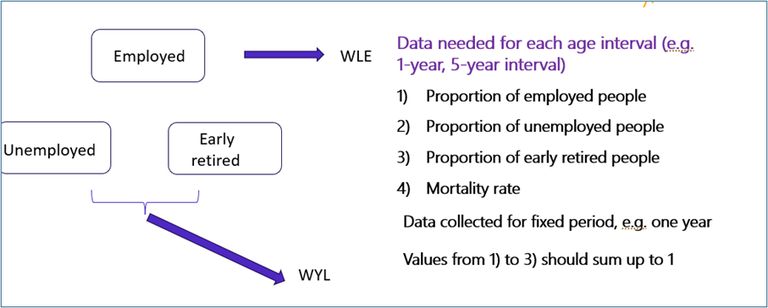
Figure 5. Example of states of interest and data needed for calculation of WLE/WYL.
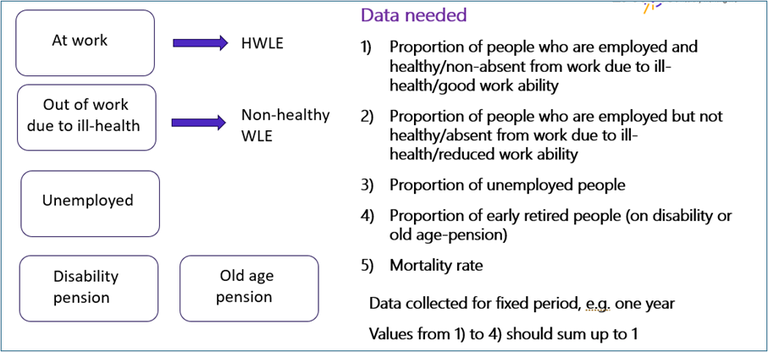
Figure 6. Example of states of interest and data needed for calculation of HWLE/WYL.
To summarise. Even though, the tool is primarily made for researchers, it can be used outside research. It is aiming to help its users apply the calculation method on their own data, which can be derived from official statistics, registers or representative population surveys. Tool can be further developed as on-line calculator.
1.0
-
Health scientists
-
Interactive